The RISeR project seeks to reconstruct the rates, magnitude and spatial patterns of sea-level change during the Last Interglacial. As part of this we seek to develop new high-resolution reconstructions of Last Interglacial sea-level change for northwest Europe using previously unstudied offshore sedimentary archives from the southern North Sea. We also aim to provide the first chronological constraints on the timing, and therefore rates, of relative sea-level change in northwest Europe.
Reconstructing Past Sea Level
We will be using a multi-proxy approach to reconstruct past sea level, including:
- Foraminiferal, diatom, and molluscan assemblages
- Detailed sedimentological analysis such as ITRAX-XRF and particle size
When combined with our new model of Glacial Isostatic Adjustment for NW Europe (GIA; Pollard et al., 6th January, 1.20 pm), a new subsidence model (Cohen et al., in review), and our new age-depth models, the RSL inferred from the reconstructions should provide multiple Sea Level Index Points (SLIPs).
Our new SLIPs will add further constraints to ongoing reconstructions of the rate and magnitude of relative sea level change for NW Europe, adding to the WALIS (World Atlas of Last Interglacial Shorelines) Database.
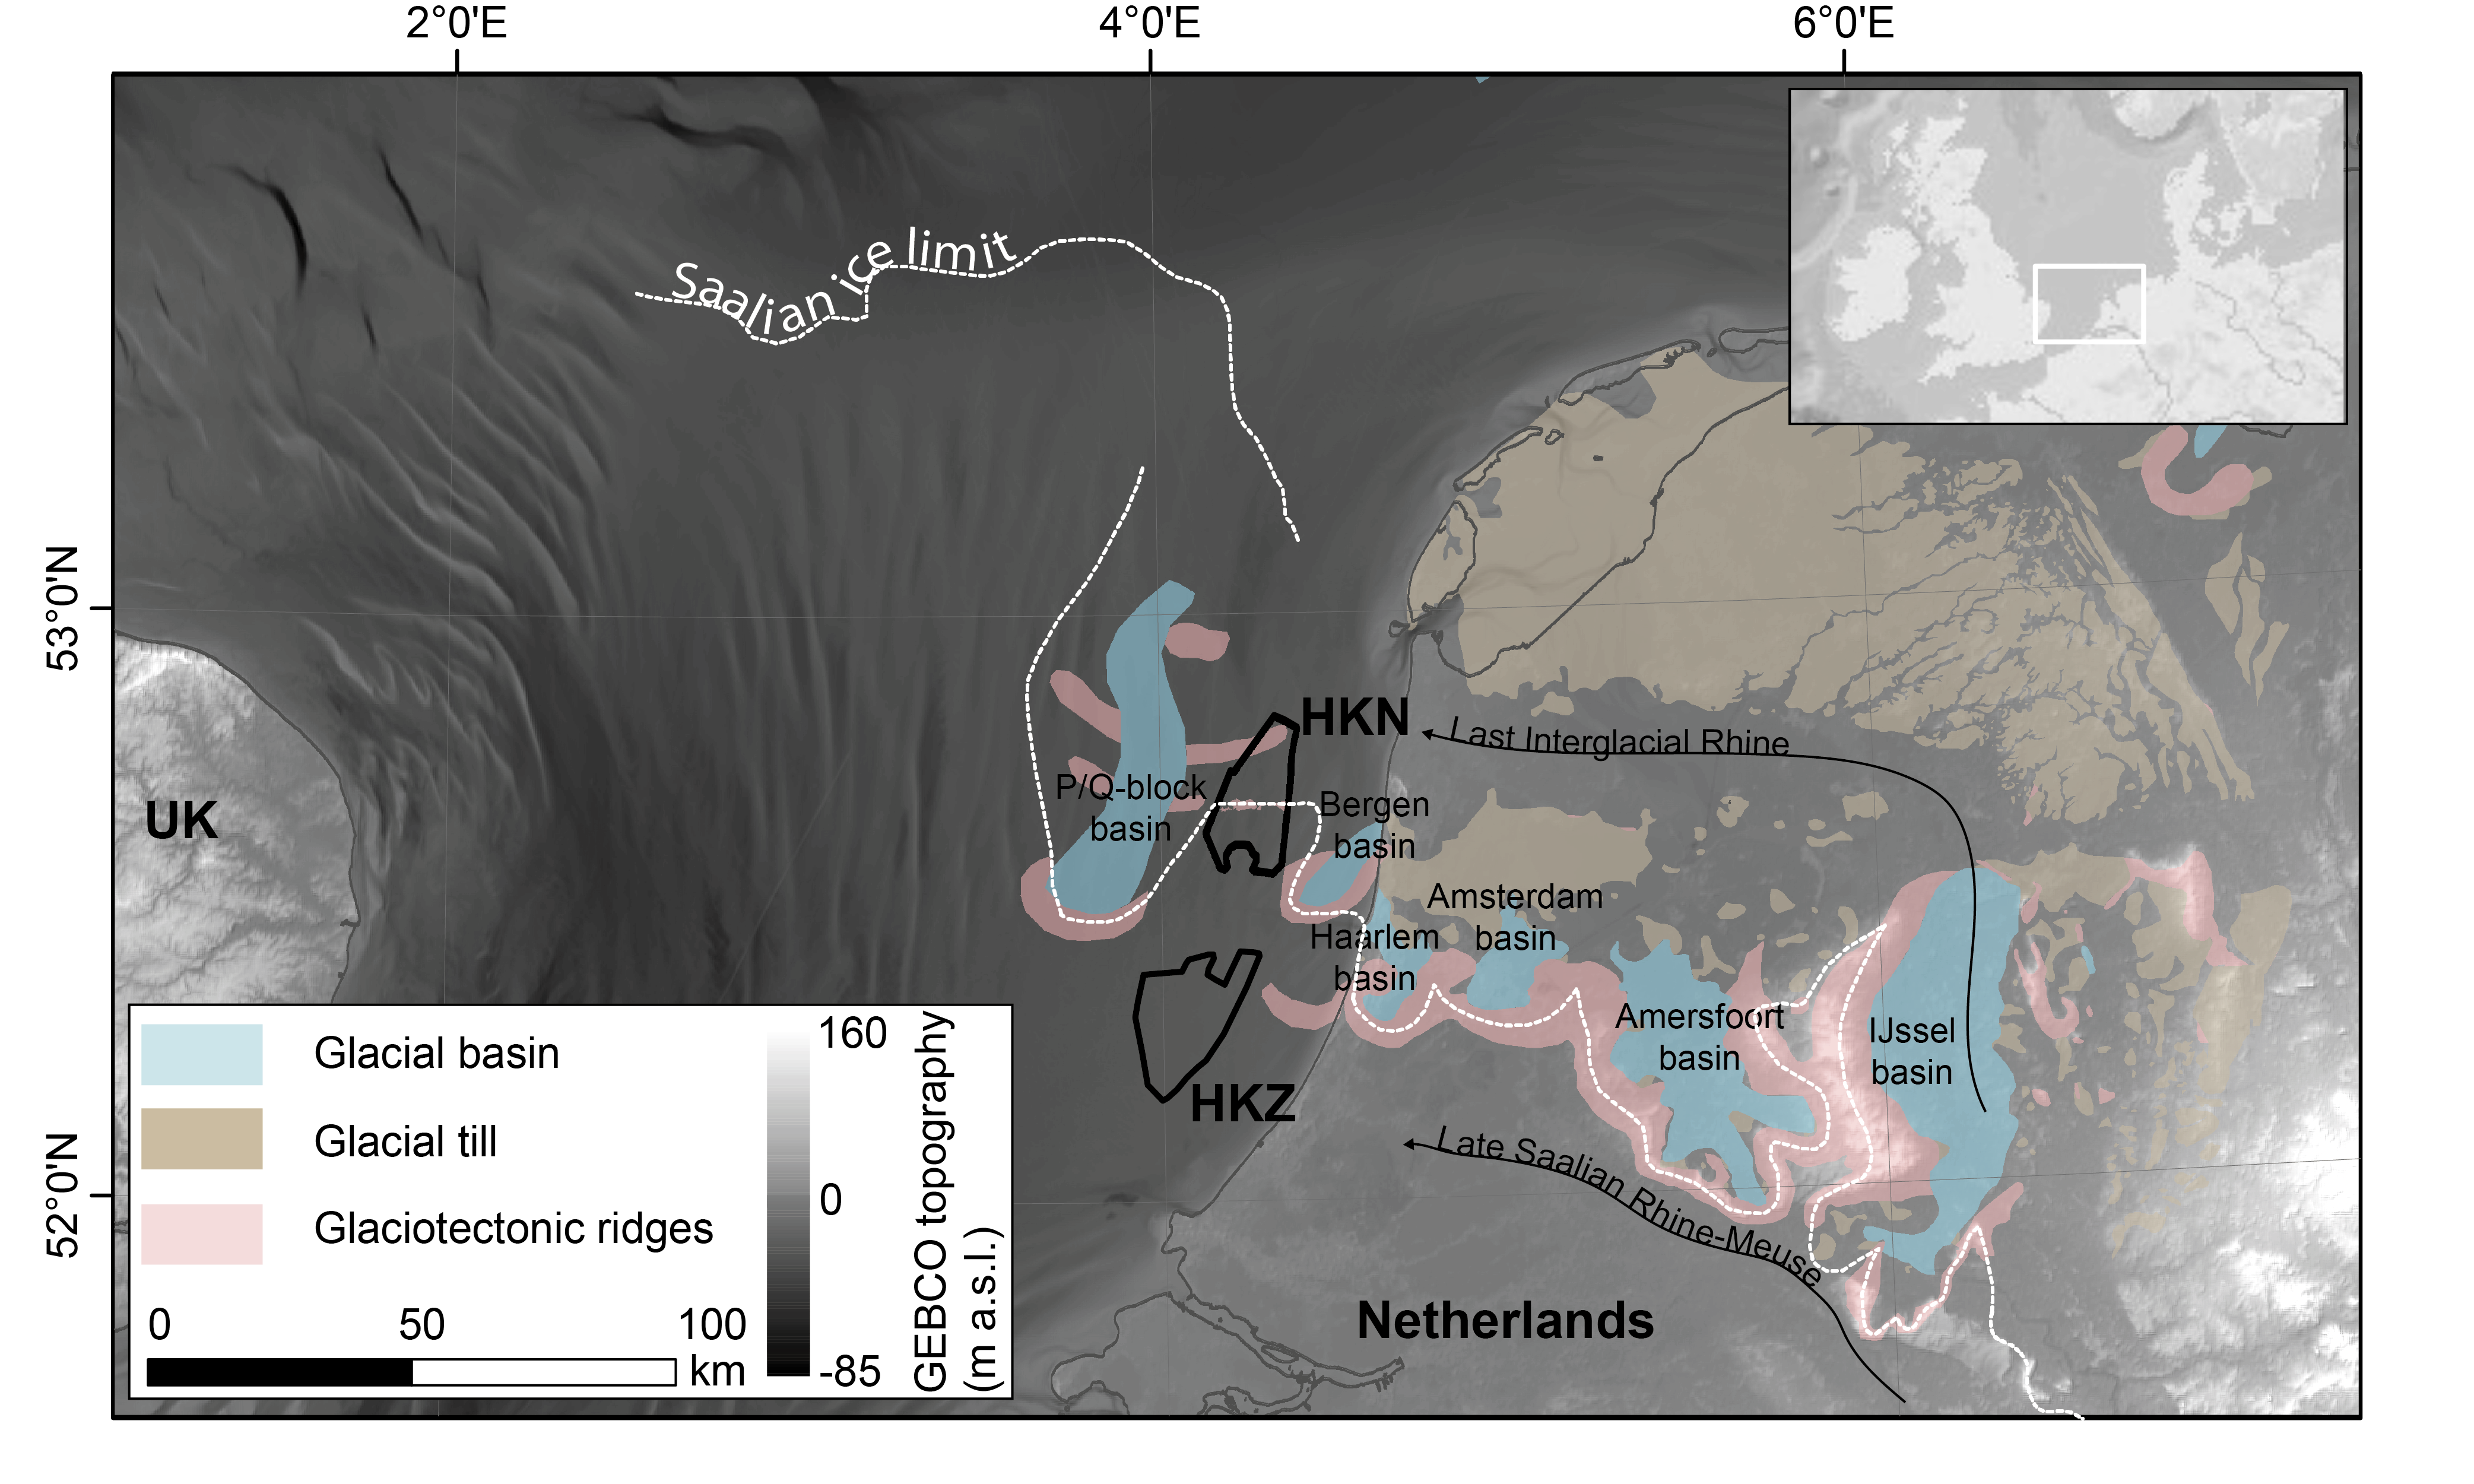
↑ Fig 1: Location of the study area in the southern North Sea showing the Hollandse Kust Zuid (HK) wind-farm, adapted from Cartelle et al., 2021.
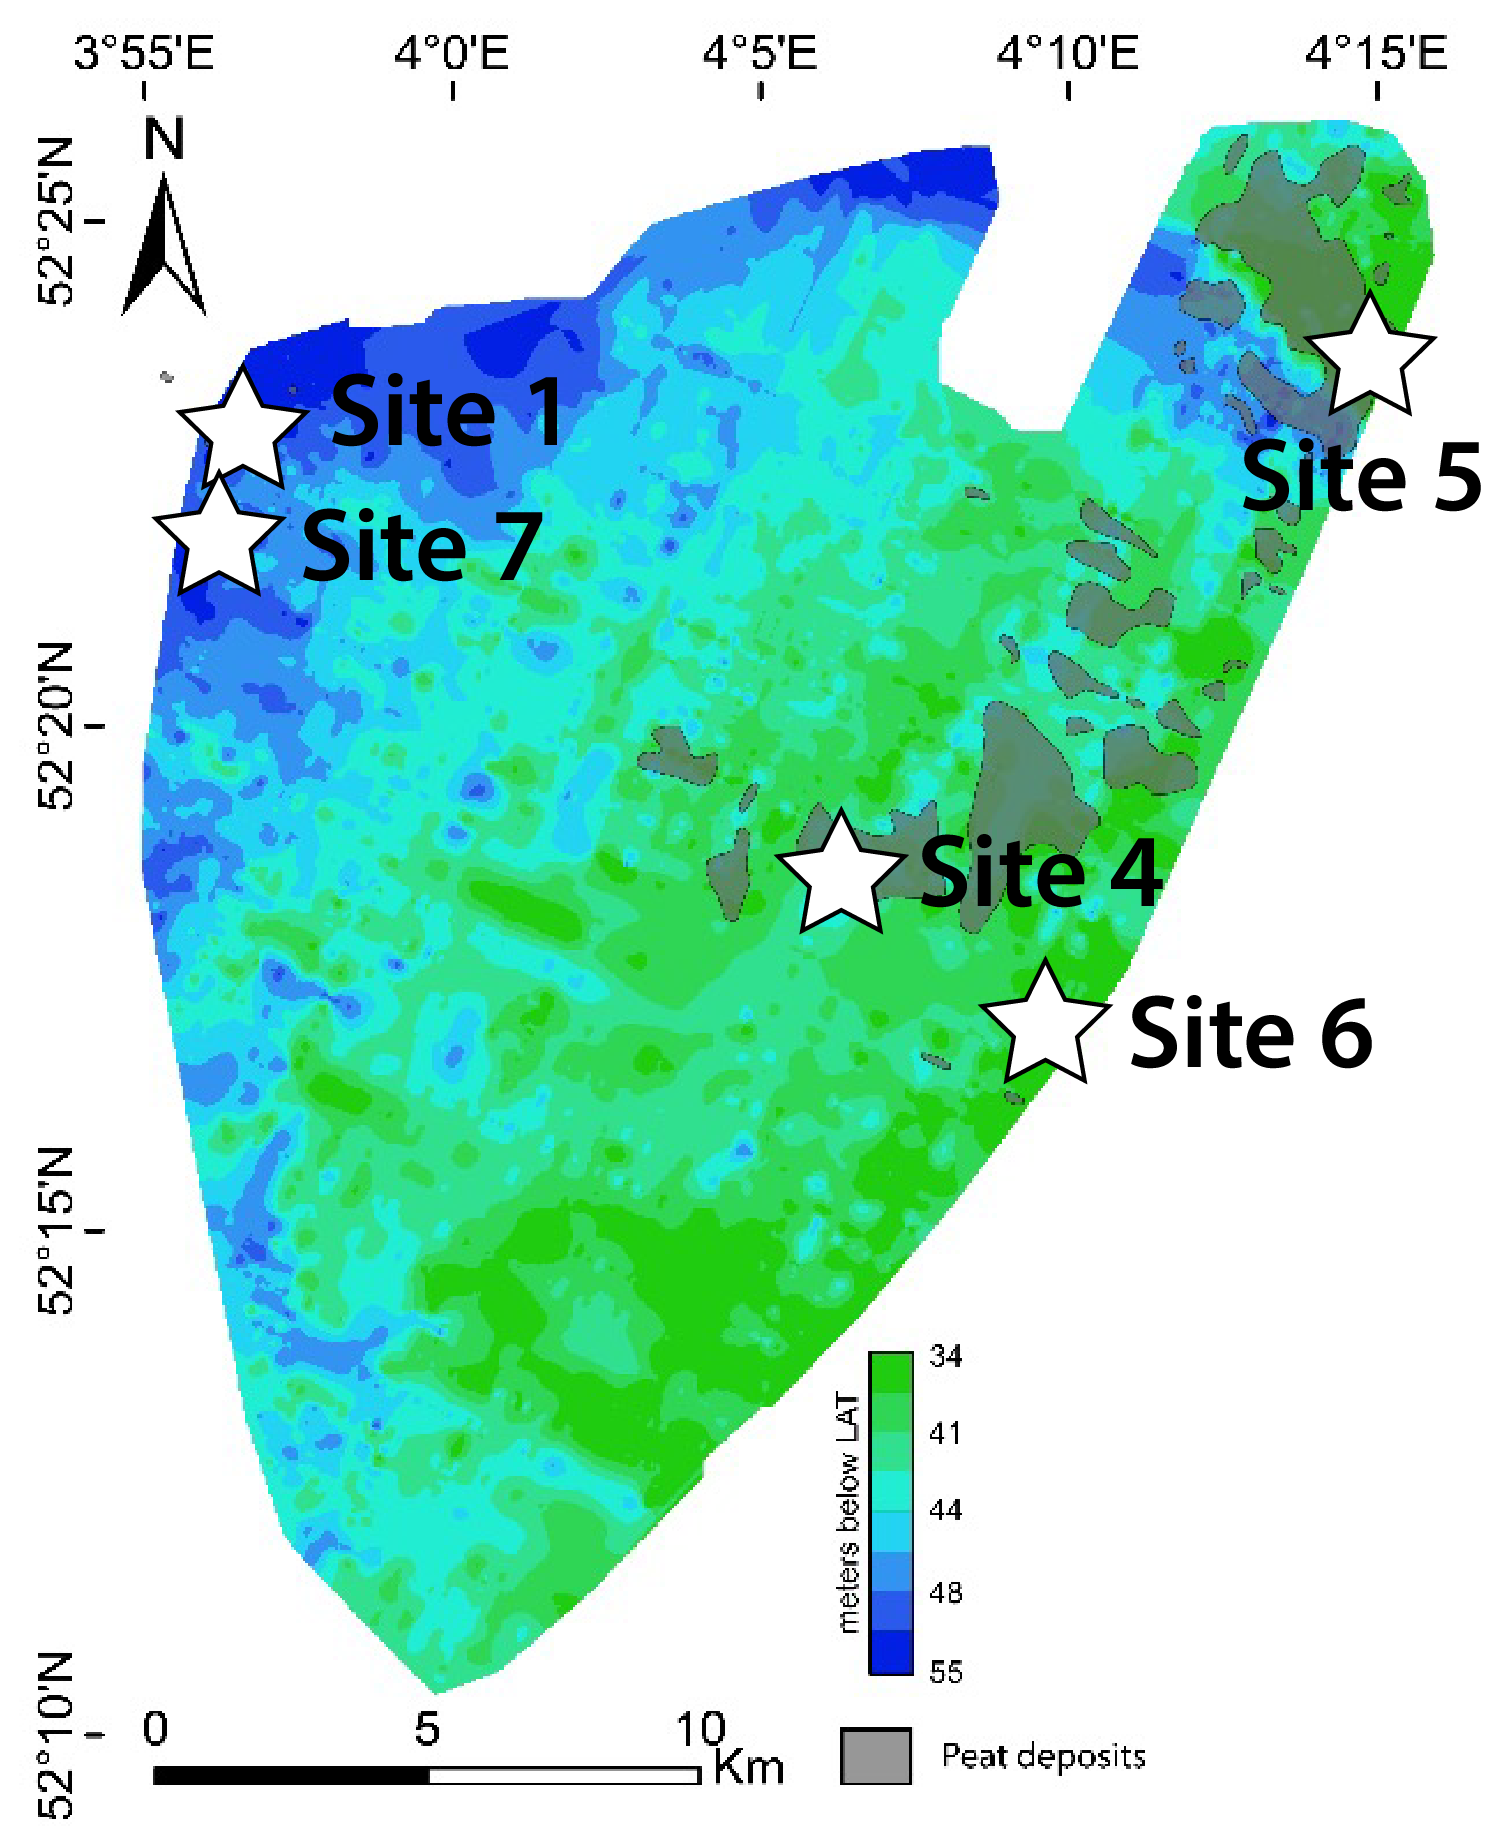
← Fig 2: Location of the RISeR boreholes within the Hollandse Kust Zuid (HKZ) wind-farm, showing the depth of the sea bed below present day lowest astronomical tide (LAT).
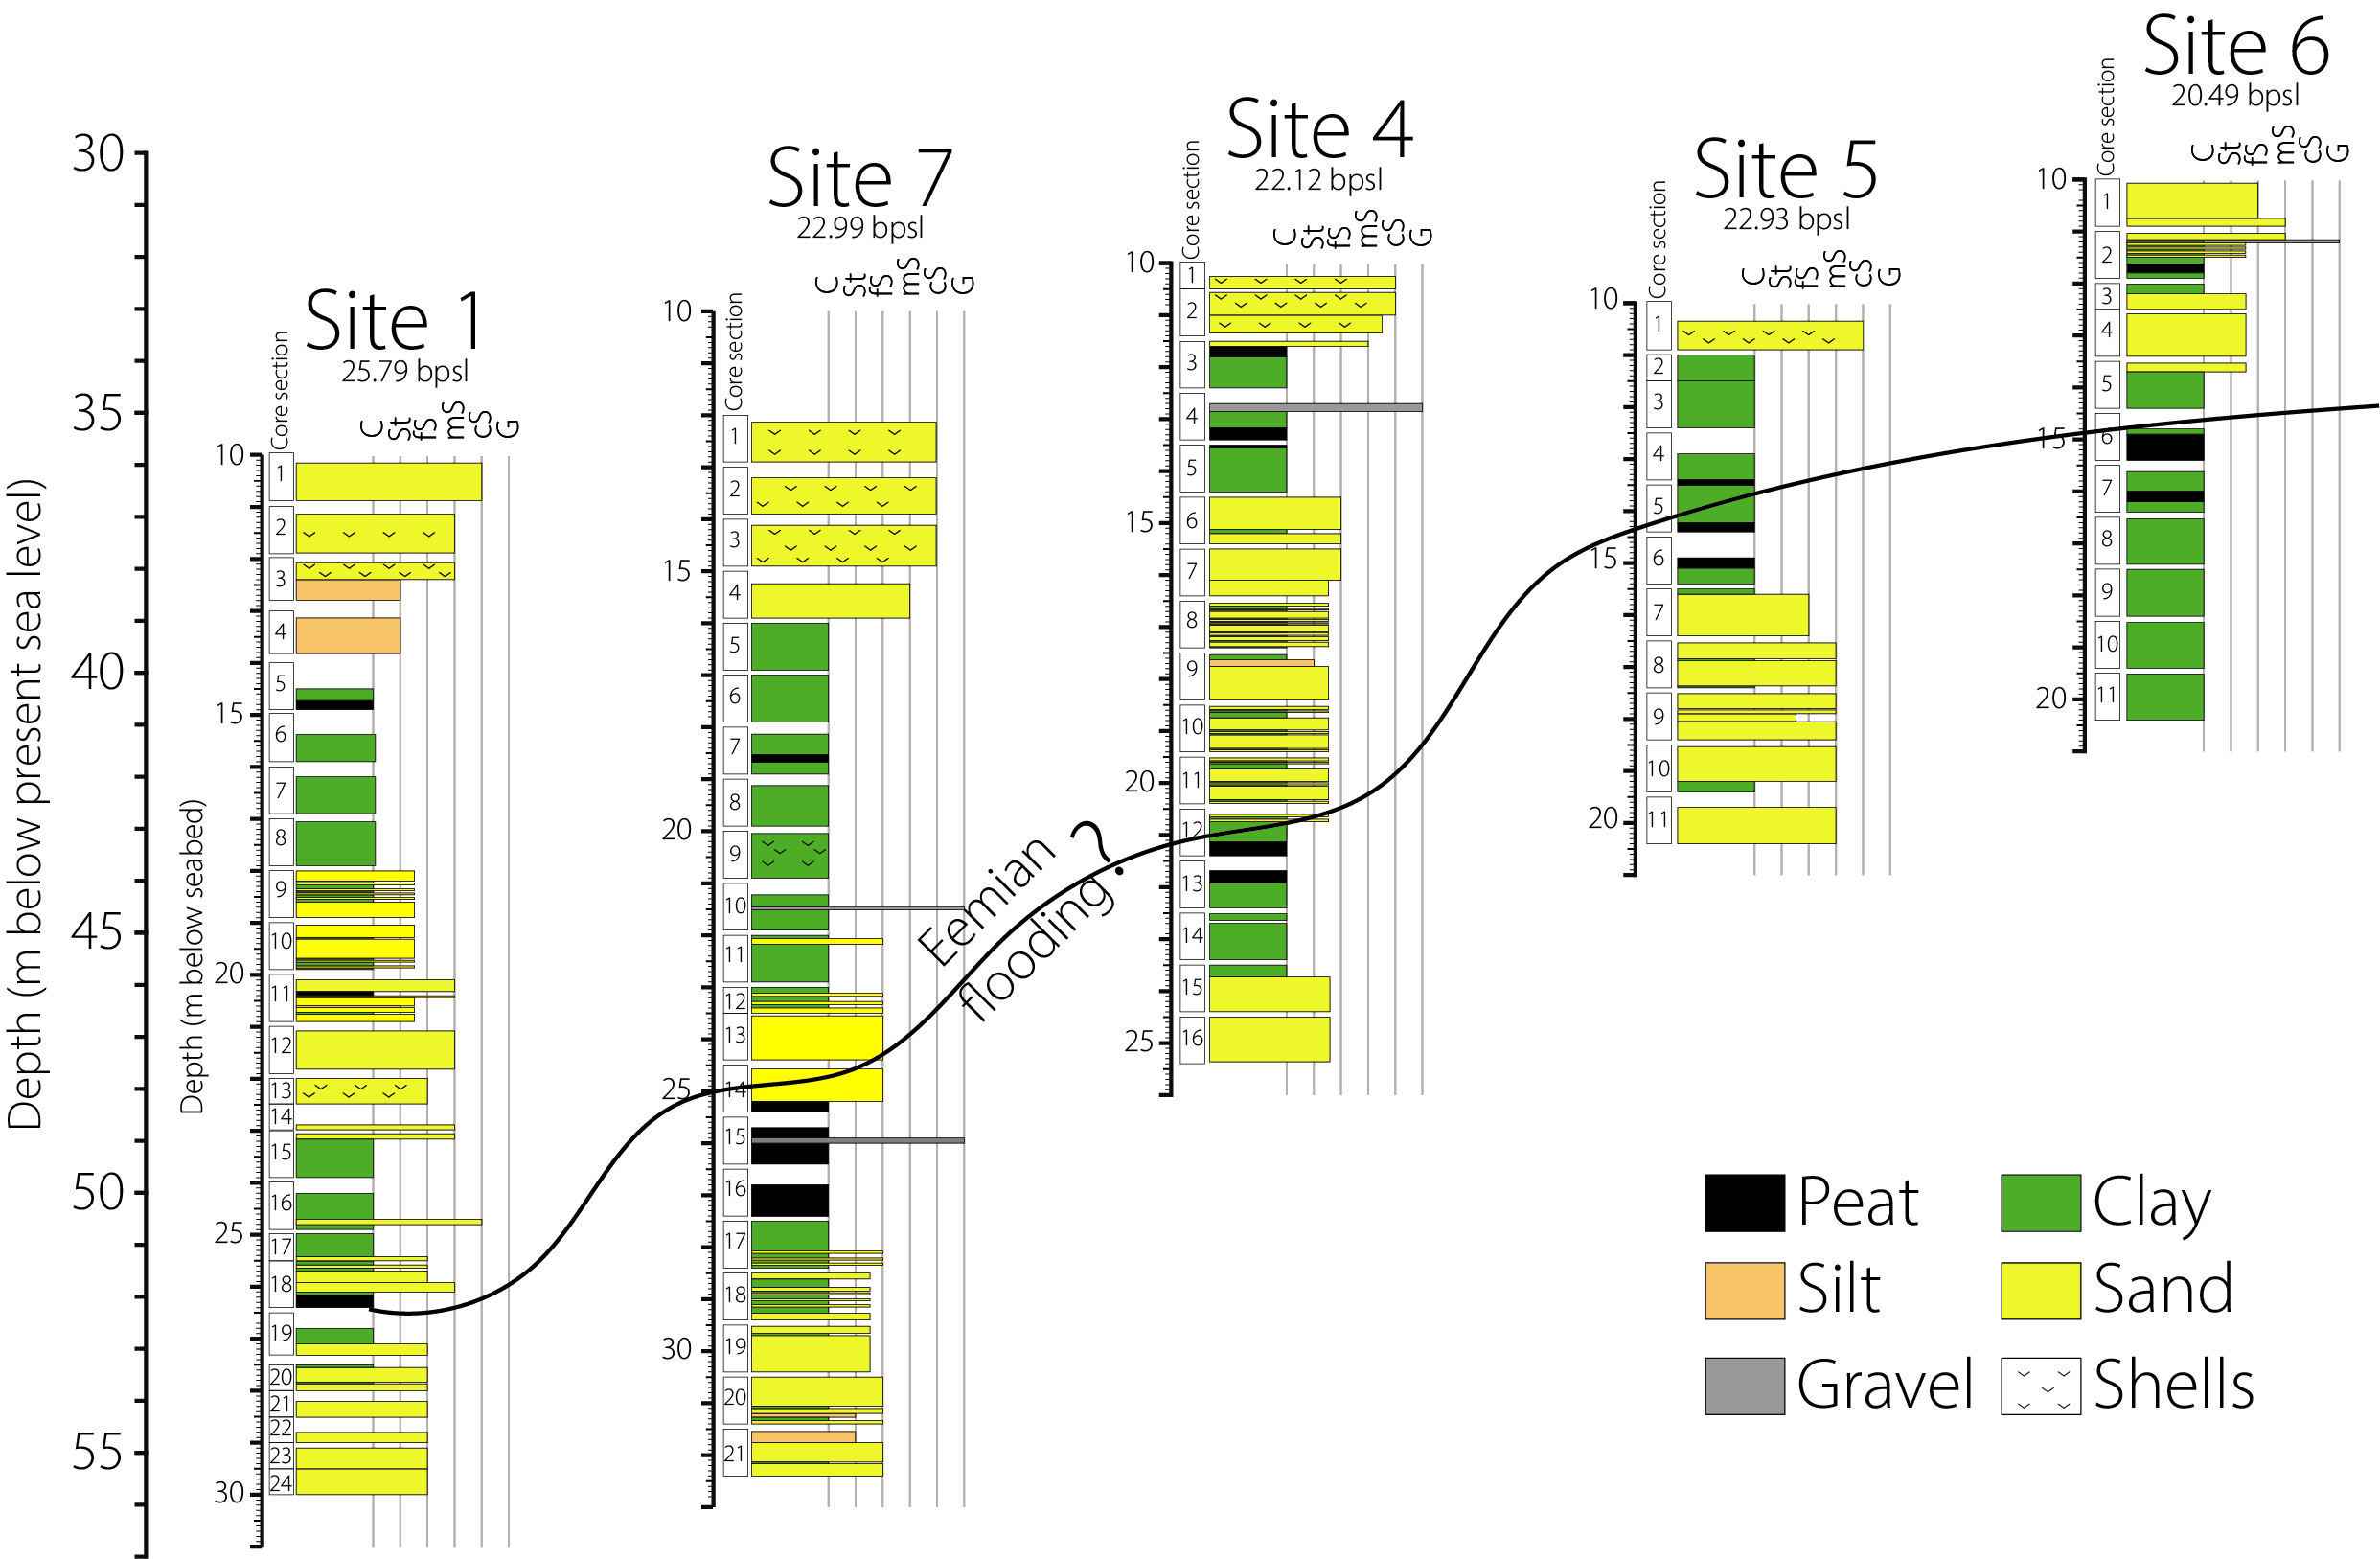 Fig 3: Stratigraphic logs of the 5 RISeR sediment cores, plotted against depth. For the location of the cores see Fig 3.
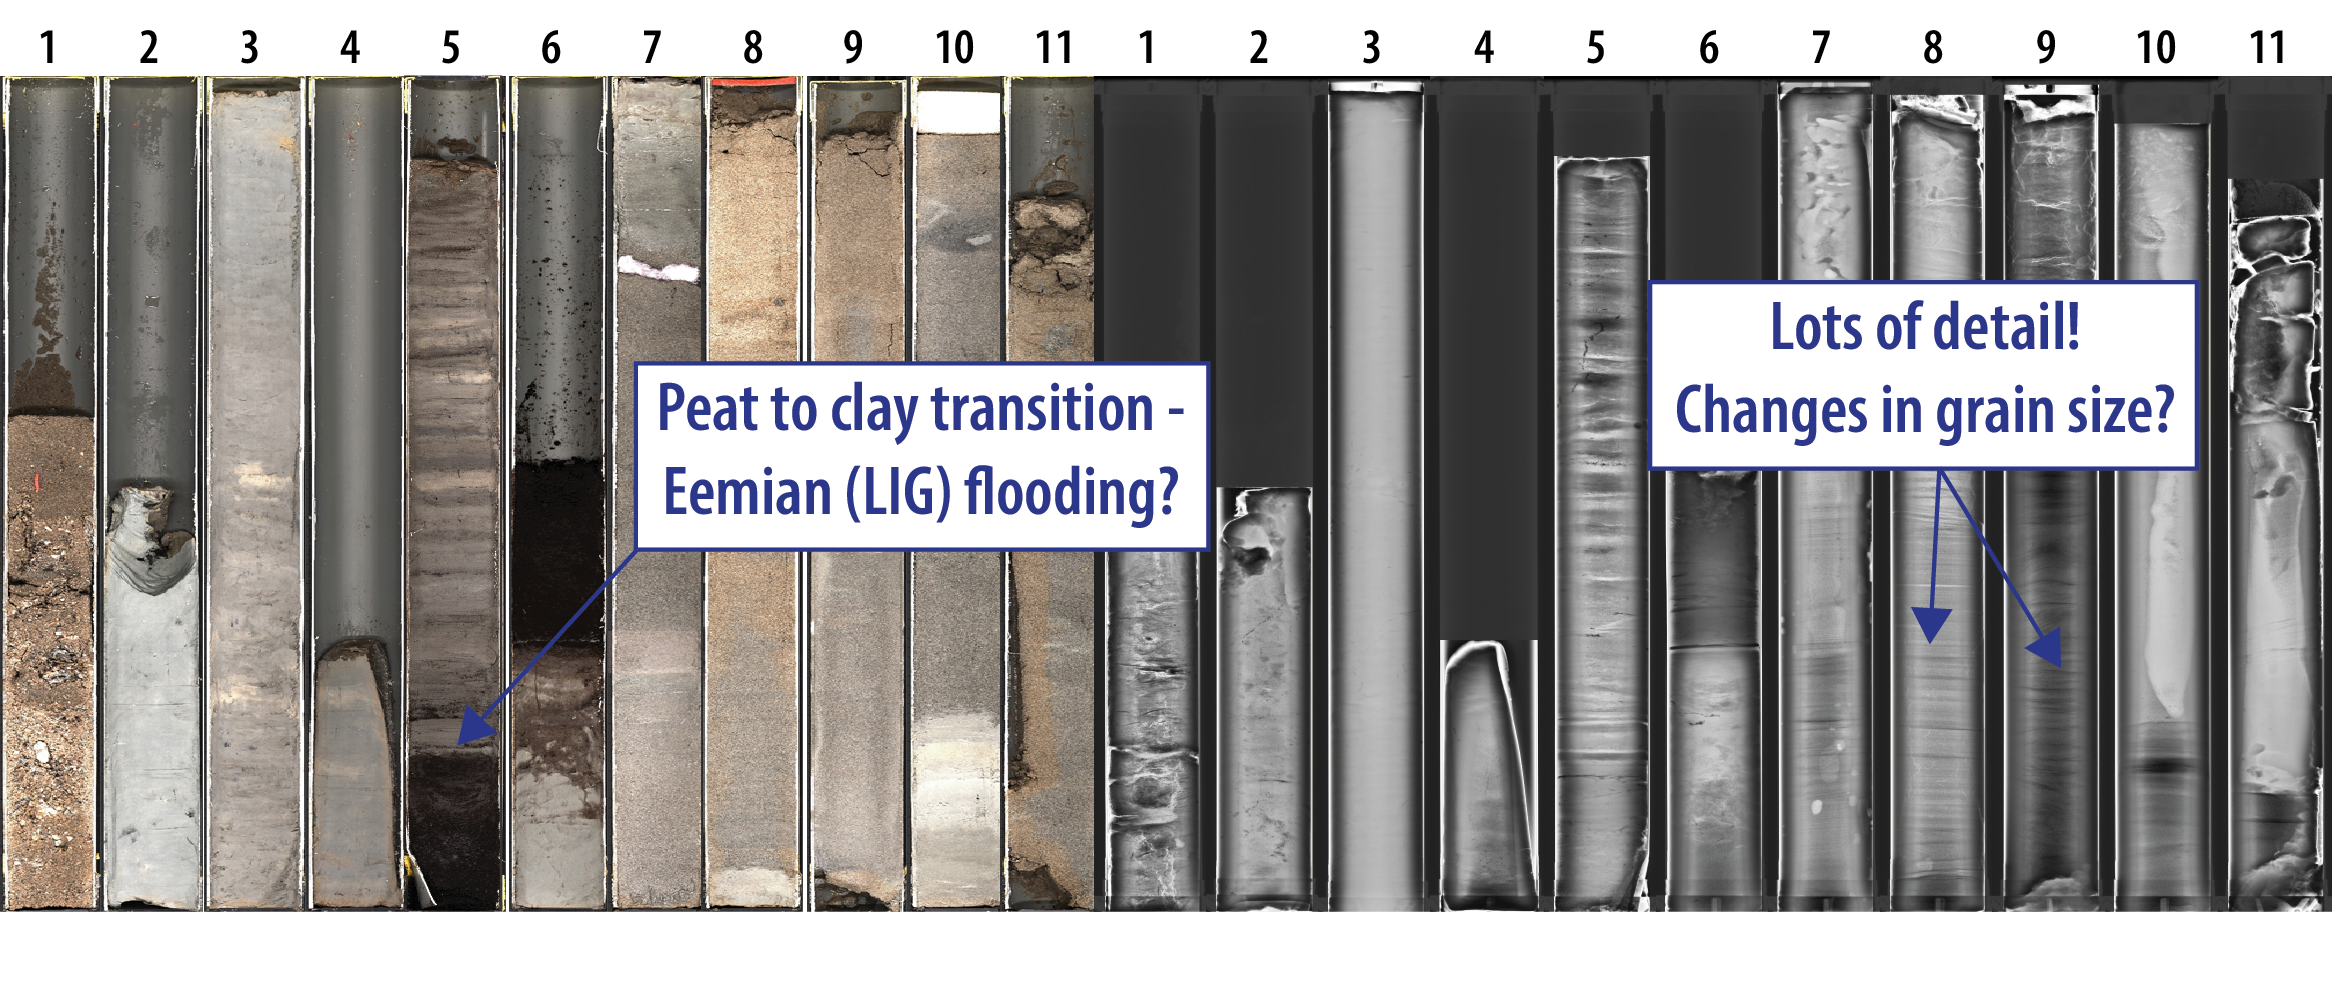 Fig 4: Images of the RISeR sediment core from Site 5 obtained using MSCL (a) and x-ray laminography (b) facilities at BOSCORF.
Dating Last Interglacial Sequences
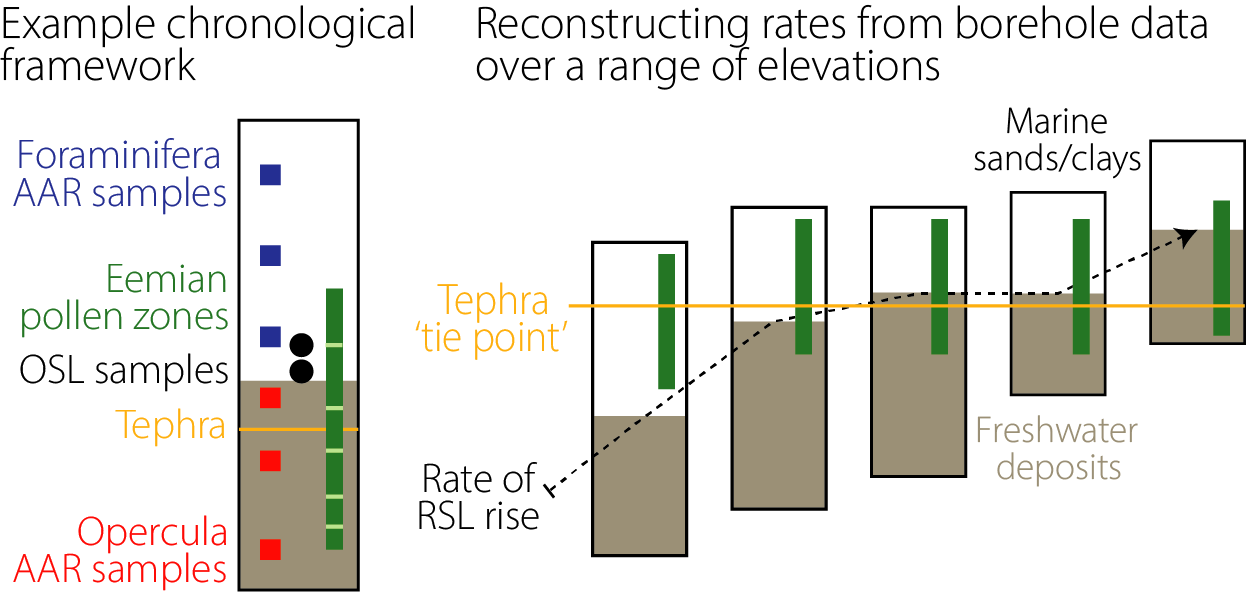
As LIG sequences are beyond the upper age limit of radiocarbon dating approaches, we are applying a range of absolute and relative dating techniques across the 5 sites, including:
- Biostratigraphy: pollen analysis (Eemian pollen zones of NW Europe) and molluscan faunal analysis.
- Luminescence dating: sand-rich sediments will be dated using Optically Stimulated Luminescence (OSL)
- Amino Acid Racemization (AAR): if suitable faunal remains are found, these will be submitted for AAR analysis.
- Tephrochronology: the identification of volcanic ash layers.
The resulting ages, and their associated uncertainties, will be used to construct a chronology for each individual site using Bayesian age-depth modelling.